- Saviynt Forums
- Enterprise Identity Cloud Discussions
- Data Access Governance
- Re: Control Center Chart not showing
- Subscribe to RSS Feed
- Mark Topic as New
- Mark Topic as Read
- Float this Topic for Current User
- Bookmark
- Subscribe
- Mute
- Printer Friendly Page
Control Center Chart not showing
- Mark as New
- Bookmark
- Subscribe
- Mute
- Subscribe to RSS Feed
- Permalink
- Notify a Moderator
09/26/2023
10:49 PM
- last edited on
09/26/2023
11:25 PM
by
![]() Sunil
Sunil
Hello,
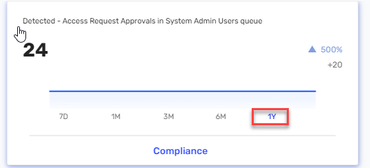
We are trying to take control centre into use, but we noticed that the bar charts associated with the KPIs, which are supposed to display daily, monthly, and yearly Charts, do not update as expected.
They remain on a straight line, even when there is a significant percentage change as highlighted in below snapshot:
How can we make those show?
Additionally, when we hover over the focus card, we are supposed to be able to see the graph trends based on those day ,month and year as shown in this screenshot:
However, the trend remains a straight line
[This message has been edited by moderator to merge reply comment content]
- Labels:
-
Control Center
- Mark as New
- Bookmark
- Subscribe
- Mute
- Subscribe to RSS Feed
- Permalink
- Notify a Moderator
10/01/2023 10:12 PM
Hi @ant
Can you provide details of the KPI configuration? What is the config present under Chart configuration?
Thanks
- Mark as New
- Bookmark
- Subscribe
- Mute
- Subscribe to RSS Feed
- Permalink
- Notify a Moderator
10/01/2023 10:59 PM
I'm not sure what configuration you need me to share, take a closer look at second screenshot (Compliance), notice at 1Y, the blue line still is horizontal. shouldn't it change based on trend?
- Mark as New
- Bookmark
- Subscribe
- Mute
- Subscribe to RSS Feed
- Permalink
- Notify a Moderator
10/03/2023 01:26 PM
Hi @ant
I'm checking internally with the product team. Will update you once I get a response from them.
Thanks
- Mark as New
- Bookmark
- Subscribe
- Mute
- Subscribe to RSS Feed
- Permalink
- Notify a Moderator
10/04/2023 08:10 PM
Hi @ant
Can you confirm if you are running the RunControlCenterHistoryJob? This Job needs to be scheduled in order to populate the historical data.
Thanks
- Mark as New
- Bookmark
- Subscribe
- Mute
- Subscribe to RSS Feed
- Permalink
- Notify a Moderator
10/17/2023 06:24 AM
Hi
Yes, we are running it daily. But maybe something wrong with that job as "Last run" column is empty and also "job history detail" page is empty.
Regards
Riku
- Mark as New
- Bookmark
- Subscribe
- Mute
- Subscribe to RSS Feed
- Permalink
- Notify a Moderator
10/23/2023 08:06 PM
Run the report
Regards,
Rushikesh Vartak
If you find the response useful, kindly consider selecting Accept As Solution and clicking on the kudos button.
- Mark as New
- Bookmark
- Subscribe
- Mute
- Subscribe to RSS Feed
- Permalink
- Notify a Moderator
10/23/2023 09:57 PM
Hi
I have run report, it doesn't help with that flat line.
Regards
Riku
- Mark as New
- Bookmark
- Subscribe
- Mute
- Subscribe to RSS Feed
- Permalink
- Notify a Moderator
10/24/2023 02:54 AM
Hi
Actually now some lines are showing some movement. But still i don't quite understand the logic behind those.
Is Control Center reading history values directly from Analytics history, or does it has own history to store results from last one year?
Regards
Riku
- Mark as New
- Bookmark
- Subscribe
- Mute
- Subscribe to RSS Feed
- Permalink
- Notify a Moderator
12/03/2023 04:47 PM
Please run below & schedule below jobs
- RunControlCenterHistoryJob
- ControlCenterAnalyticsJob
Regards,
Rushikesh Vartak
If you find the response useful, kindly consider selecting Accept As Solution and clicking on the kudos button.
- Mark as New
- Bookmark
- Subscribe
- Mute
- Subscribe to RSS Feed
- Permalink
- Notify a Moderator
11/14/2023 06:22 AM
Hi @RikuN
You need to run the RunControlCenterHistoryJob daily in order for the graph data to show up properly. Please make sure that job is scheduled to run regularly.
Thanks
- Mark as New
- Bookmark
- Subscribe
- Mute
- Subscribe to RSS Feed
- Permalink
- Notify a Moderator
12/04/2023 10:46 PM
Hi
Now we are seeing some movement in lines, so i think this was the solution. I dont' see "Accept as solution" button, so i can't accept this:
"
Please run below & schedule below jobs
- RunControlCenterHistoryJob
- ControlCenterAnalyticsJob
"
We still don't see anything in RunControlCenterHistoryJob run history page, should there be seen something?
Regards
Riku
- Mark as New
- Bookmark
- Subscribe
- Mute
- Subscribe to RSS Feed
- Permalink
- Notify a Moderator
12/13/2023 03:04 AM
yes @RikuN
For control center job , run history will be blank but the data should populate and you should be able to see data in control center now.
Thanks
Darshan
- Mark as New
- Bookmark
- Subscribe
- Mute
- Subscribe to RSS Feed
- Permalink
- Notify a Moderator
12/18/2023 06:37 PM
Is this resolved ?
Regards,
Rushikesh Vartak
If you find the response useful, kindly consider selecting Accept As Solution and clicking on the kudos button.
- Mark as New
- Bookmark
- Subscribe
- Mute
- Subscribe to RSS Feed
- Permalink
- Notify a Moderator
12/13/2023 04:11 AM
Hi
Ok, this is then clear.
Regards
Riku
- Coupa import doesn't work in Identity Governance & Administration
- Need help in email template creation for Advanced HTML CSS in Identity Governance & Administration
- Feature Access: New Topics in Control Center in Identity Governance & Administration
- Control Center Application Reporting in Identity Governance & Administration
- Saviynt UI Improvements for mouse/kb devices (Tampermonkey Script) in Identity Governance & Administration


