- Saviynt Forums
- Enterprise Identity Cloud Discussions
- Identity Governance & Administration
- Re: How to Plot analytics history in Line dashboar...
- Subscribe to RSS Feed
- Mark Topic as New
- Mark Topic as Read
- Float this Topic for Current User
- Bookmark
- Subscribe
- Mute
- Printer Friendly Page
- Mark as New
- Bookmark
- Subscribe
- Mute
- Subscribe to RSS Feed
- Permalink
- Notify a Moderator
09/02/2022 05:22 AM
Hi all,
Following the dashboard documentation, in particular the Line Chart (https://saviynt.freshdesk.com/support/solutions/articles/43000500996-dashboards#Dashboards-Dashboard...) we can see that it should be possible to plot a temporal progression.
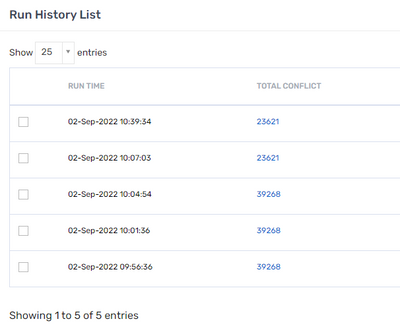
Is there a way to navigate the analytic history of a specific analytic and plot the record count in the different executions?
e.g. I want to plot this data:
Kind regards,
Matteo
Solved! Go to Solution.
- Labels:
-
Admin
-
Analytics
-
Intelligence
- Mark as New
- Bookmark
- Subscribe
- Mute
- Subscribe to RSS Feed
- Permalink
- Notify a Moderator
09/02/2022 05:36 AM
This data comes from Elastic Search hence line chart for this is not possible 😞
Regards,
Rushikesh Vartak
If you find the response useful, kindly consider selecting Accept As Solution and clicking on the kudos button.
- Mark as New
- Bookmark
- Subscribe
- Mute
- Subscribe to RSS Feed
- Permalink
- Notify a Moderator
09/02/2022 05:45 AM
Ok, thank you for the quick reply.
Do you know if elastic search-based line charts will be released in future updates?
Kind regards,
Matteo
- Mark as New
- Bookmark
- Subscribe
- Mute
- Subscribe to RSS Feed
- Permalink
- Notify a Moderator
09/02/2022 05:55 AM
Elasticsearch is a search engine based on the Lucene library. It provides a distributed, multitenant-capable full-text search engine with an HTTP web interface and schema-free JSON documents.
if you think this will be good idea maybe it can be achevied using REST API , you can submit idea to saviynt https://ideas.saviynt.com/
Regards,
Rushikesh Vartak
If you find the response useful, kindly consider selecting Accept As Solution and clicking on the kudos button.
- Mark as New
- Bookmark
- Subscribe
- Mute
- Subscribe to RSS Feed
- Permalink
- Notify a Moderator
01/13/2023 11:05 AM
Is it possible to show ES history data in any kind of dashboard then? I have a requirement to have a dashboard graph showing count of users of a certain type at certain time intervals but there is not an easy way to show the historical data without redirecting to the analytic itself.
- Unable to create a Simple Bar Chart dashboard with Endpoint filters. in Identity Governance & Administration
- Unable to Run Analytics assigned to a SAV Role in Identity Governance & Administration
- Actionable Analytic Error: Failure : Cannot invoke method split() on null object in Identity Governance & Administration
- Runtime analytics _ issue with fetching data in Identity Governance & Administration
- Control Center Intelligence KPI Creation Failed in Identity Governance & Administration

