- Saviynt Forums
- Enterprise Identity Cloud Discussions
- Identity Governance & Administration
- Application logs monitoring
- Subscribe to RSS Feed
- Mark Topic as New
- Mark Topic as Read
- Float this Topic for Current User
- Bookmark
- Subscribe
- Mute
- Printer Friendly Page
Application logs monitoring
- Mark as New
- Bookmark
- Subscribe
- Mute
- Subscribe to RSS Feed
- Permalink
- Notify a Moderator
01/13/2023 08:39 AM
Application logs UI restricts users to see only 1000 lines of logs. most of the time its very difficult to find complete flow of events including errors/exceptions.
is there any other/better way to pull application logs from saviynt and then go through it to debug issues.
- Labels:
-
Other
- Mark as New
- Bookmark
- Subscribe
- Mute
- Subscribe to RSS Feed
- Permalink
- Notify a Moderator
01/13/2023 08:45 AM
Unfortunately that's the limitation in v2021.x version. Which is improved in later versions(v2022)
Regards,
Saathvik
If this reply answered your question, please Accept As Solution and give Kudos to help others facing similar issue.
- Mark as New
- Bookmark
- Subscribe
- Mute
- Subscribe to RSS Feed
- Permalink
- Notify a Moderator
01/13/2023 08:56 AM
whats the improvement in 2022? any links to go through it as we are planning to move to 2022.
- Mark as New
- Bookmark
- Subscribe
- Mute
- Subscribe to RSS Feed
- Permalink
- Notify a Moderator
01/13/2023 09:00 AM
https://saviynt.litmos.com/home/LearningPath/188644?r=False&ts=638092043335678929
Regards,
Rushikesh Vartak
If you find the response useful, kindly consider selecting Accept As Solution and clicking on the kudos button.
- Mark as New
- Bookmark
- Subscribe
- Mute
- Subscribe to RSS Feed
- Permalink
- Notify a Moderator
01/13/2023 09:00 AM - edited 01/13/2023 09:05 AM
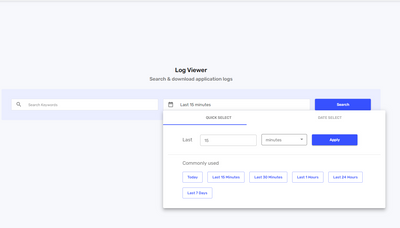
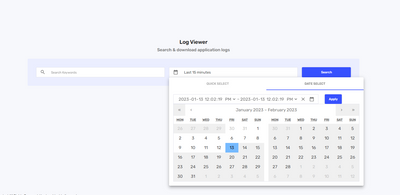
In v2022,
1. There is no limitation on number lines. You can scroll down to infinite
2. You can download 10000 lines
3. You can find the sequences of logs by +1 minute and -1(minute)
4. You can filter time period by prefixed values or you can enter the value manually (which is not supported in v2021)
Below is the view it looks like
Regards,
Saathvik
If this reply answered your question, please Accept As Solution and give Kudos to help others facing similar issue.
- Mark as New
- Bookmark
- Subscribe
- Mute
- Subscribe to RSS Feed
- Permalink
- Notify a Moderator
01/13/2023 08:52 AM
1) Make the maximum number of lines to 1000
2) Make the time window as short as possible.
3) Filter on 'Service Name' for the type of logs you want to see. By default, all Services are selected. Description on a few service names are mentioned below:
ecm --> View logs for ECM UI in any ECM pages
ecm-worker --> View logs for any jobs that run from the job control panel
userms --> Sync job logs
arsms/idwms --> Request Home Logs based on the api being called.
pamms --> PAM service logs.
3) Once you have modified the above, search again and it should give you a more focused view on the logs you wish to see.
Regards,
Rushikesh Vartak
If you find the response useful, kindly consider selecting Accept As Solution and clicking on the kudos button.
- Mark as New
- Bookmark
- Subscribe
- Mute
- Subscribe to RSS Feed
- Permalink
- Notify a Moderator
01/13/2023 09:02 AM
thanks rushikesh for quick and detailed revert. i have followed these suggestions already but still its difficult to find required logs. choosing time slot doesnt help much as the interval is of 30 mins. if they allow users to select any time like 11:21 OR 11:35 then it would be very helpful.
- Mark as New
- Bookmark
- Subscribe
- Mute
- Subscribe to RSS Feed
- Permalink
- Notify a Moderator
01/13/2023 09:03 AM
I agree but thats what it is , can't help till next upgrade ;(
Regards,
Rushikesh Vartak
If you find the response useful, kindly consider selecting Accept As Solution and clicking on the kudos button.
- Mark as New
- Bookmark
- Subscribe
- Mute
- Subscribe to RSS Feed
- Permalink
- Notify a Moderator
01/13/2023 09:10 AM
Yes that is addressed in v2022. You can select any time like minutes
Regards,
Saathvik
If this reply answered your question, please Accept As Solution and give Kudos to help others facing similar issue.
- Log4j2 logging deployed an external jar in saviynt in Identity Governance & Administration
- Illegal character error in Web Service response in Identity Governance & Administration
- REST Connector - Unable to Use Connection Binding Object in Import JSON in Identity Governance & Administration
- REST Connection- FULL IMPORT ACCOUNT JOB failure in Identity Governance & Administration
- Print the content of the analytics in the email body in Identity Governance & Administration


